Integrated Bulk and Single-Cell Transcriptomic and Metabolic Differences in Human and Mouse Immune Cells
Transcriptomics & Metabolic Modeling
| Year | 2026 |
|---|---|
| Location | IISc |
| Tags | RNA-seq, DESeq2, WGCNA, COMPASS |
Bulk and single-cell RNA-seq of T-cell populations in human and mouse chronic inflammation: WGCNA gene modules, COMPASS metabolic modelling, and Seurat clustering with trajectory and pseudotime analysis.
Jun 2025 – Jun 2026 at IISc, Bangalore, supervised by Dr. Payel Roy.
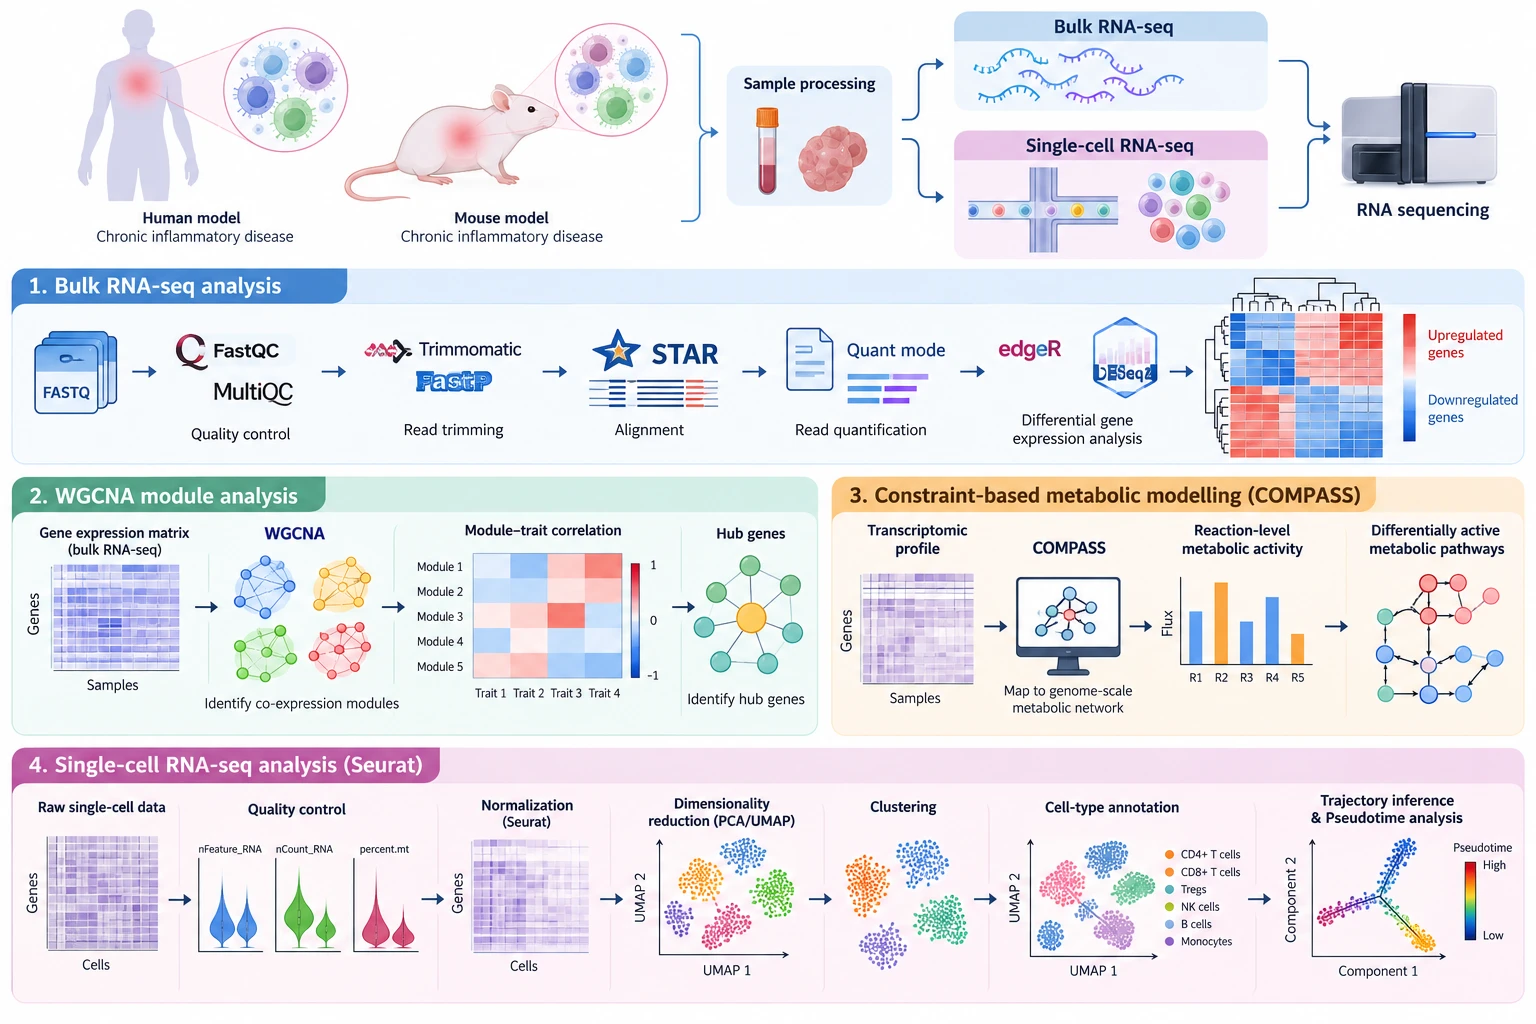
- 01Study design & sequencing
T-cell populations from human and mouse models of chronic inflammatory disease, processed into samples and sequenced two ways: bulk RNA-seq for population-level expression and single-cell RNA-seq to see the cells individually.
Bulk RNA-seq, Single-cell RNA-seq - 02Bulk RNA-seq processing
Quality control of the raw FASTQ reads, adapter and quality trimming, splice-aware alignment to the reference genome and read quantification, then differential gene expression to find up- and down-regulated genes.
FastQC, MultiQC, Trimmomatic, fastp, STAR, STAR quant mode, edgeR, DESeq2 - 03Co-expression modules (WGCNA)
Built gene co-expression networks from the bulk expression matrix to find modules of genes that move together, correlated each module with immune-cell states and disease traits, and picked out the hub genes at the centre of each module.
WGCNA, Module–trait correlation, Hub-gene analysis - 04Metabolic modelling (COMPASS)
Mapped the transcriptomic profiles onto a genome-scale metabolic network with constraint-based modelling to infer reaction-level metabolic activity, quantify flux differences, and find differentially active pathways and state-specific metabolic programs.
COMPASS, Genome-scale metabolic network, Flux analysis - 05Single-cell analysis (Seurat)
Cell-level quality control (genes and counts per cell, mitochondrial fraction), normalisation, PCA and UMAP, clustering and cell-type annotation (CD4+ and CD8+ T cells, Tregs, NK cells, B cells, monocytes), then trajectory inference and pseudotime to follow how cell states change.
Seurat, PCA / UMAP, Clustering, Cell-type annotation, Trajectory inference, Pseudotime